
U.S. Life Insurance Activity Continues to Grow in February 2023
Ages 0-30 outpace other age bands in growth
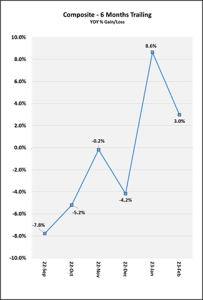
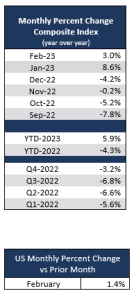
U.S. life insurance application activity continued to grow in February, with Year-over-Year (YOY) activity up +3.0%. When comparing February 2023 to the same month in prior years, activity was flat at -1.0% compared to 2021, up +6.3% compared to 2020 and up +7.9% compared to 2019. On a Year-to-Date (YTD) basis, activity through February 2023 was up +5.9% compared to February 2022. On a Month-over-Month (MOM) basis, February was flat at +1.4% compared to record breaking activity in January.
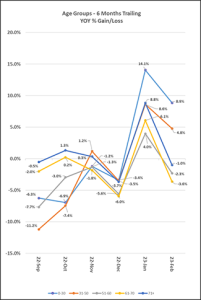
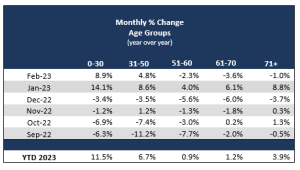
Continuing a pattern that began in December of 2022, ages 0-30 out paced other age bands in YOY growth. YOY activity for ages 0-30 was up +8.9% YOY, ages 31-50 up +4.8%, ages 51-60 down -2.3%, ages 61-70 down -3.6%, and ages 71+ flat at -1.0%.
When examining YOY activity by face amounts, all face amounts saw growth, in the double digits for amounts over $1M up to and including $5M. It is interesting to note that this is the same growth pattern by face amount that was observed in January. When including age bands, ages 0-30 saw growth across all face amounts, in the double digits for amounts up to and including $5M. Ages 31-50 saw growth across all face amounts, in the double digits for amounts over $1M up to and including $5M. Ages 51-60 saw growth for face amounts over $500K up to and including $5M, flat activity for for amounts over $250K up to and including $500K, and declining activity for all other face amounts. Ages 61-70 saw declines for amounts up to and including $250K, growth for amounts over $250K up to and including $500K, declines for amounts over $500K up to and including $1M, double-digit declines for amounts over $1M up to and including $2.5M, double-digit growth for amounts over $2.5M up to and including $5M, and flat activity for amounts over $5M. Ages 71+ saw flat activity for amounts up to and including $250K, and declines across all other face amounts, in the double digits for amounts over $500K.
February 2023 saw double-digit YOY growth for Universal Life, growth for Term Life, and flat activity for Whole Life. Specifically, Universal Life was up +13.1%, Term Life up +4.3% and Whole Life flat at +0.7%. It is interesting to note that Whole Life has consistently seen the least amount of YOY growth across all product types since February of 2022.
When examining activity by product and age band, Universal Life consistently lead with YOY growth across all age bands, in the double digits for ages 0-60 and 71+. Term Life saw growth for ages 0-50, flat activity for ages 51-60, and double-digit declining activity for ages 61+. Whole Life saw growth for ages 0-50, and declining activity for ages 51+. Worthy of noting, ages 0-30 saw double-digit YOY growth across all product types.
Originally by: MIB