

U.S. Life Insurance Application Activity Remains Flat in November 2024
Growth for ages 0-30 YOY
December 5, 2024
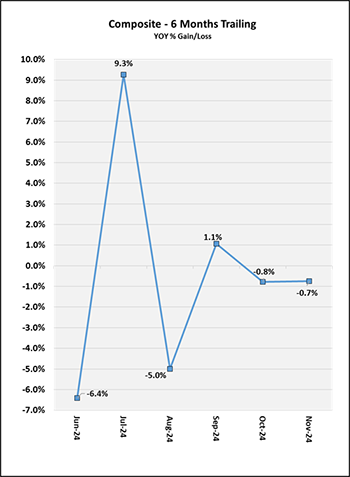
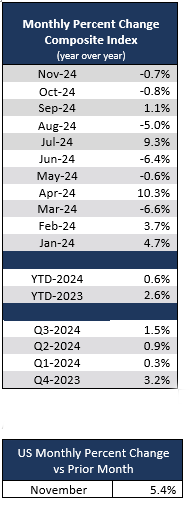
U.S. life insurance application activity was flat in November 2024 compared to November 2023, with Year-over-Year (YOY) activity at -0.7%. On a Year-to-Date (YTD) basis, activity through November 2024 was also flat at +0.6% compared to November 2023. When taking a historical lookback, activity in November was up +3.1% YTD compared to November 2022 and down -2.6% YTD compared to November 2021. On a Month-over-Month (MOM) basis, activity in November 2024 was up +5.4% compared to October 2024.
When comparing activity through November 2024 to the same period in prior years, activity was up +3.1% YTD compared to 2022 and down -2.6% YTD compared to 2021. On a Month-over-Month (MOM) basis, November 2024 was up +5.4% compared to October 2024.
Composite 6 Months TrailingAge Groups – 6 Months Trailing
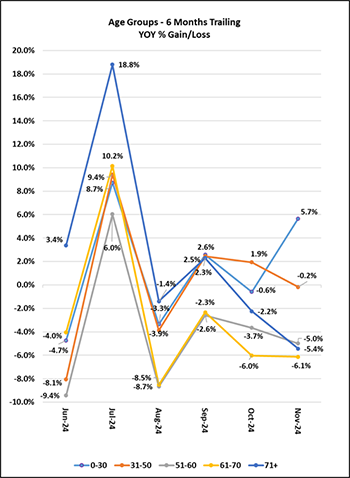
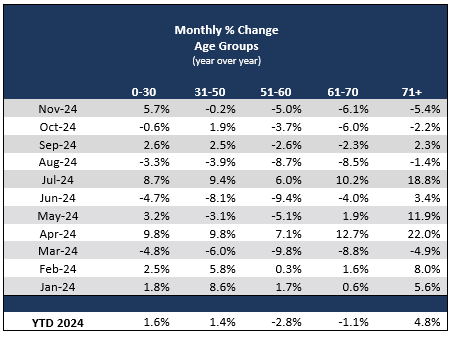
Ages 0-30 saw growth YOY in November 2024, while ages 31-50 saw flat activity, and all other age bands saw declines. November YOY activity for ages 0-30 was up +5.7%, ages 31-50 flat at -0.2%, ages 51-60 down -5.0%, ages 61-70 down -6.1%, and ages 71+ down -5.4%. On a Year-to-Date (YTD) basis, ages 0-30 and ages 71+ saw growth, ages 51-60 saw declines, and other ages bands saw flat activity. November YTD activity for ages 0-30 was up +1.6%, ages 31-50 flat at +1.4%, ages 51-60 down -2.8%, ages 61-70 flat at -1.1%, and ages 71+ up +4.8%.
When examining YOY activity for November 2024 by face amounts, we saw YOY growth for amounts up to and including $5M, in the double digits for amounts over $250K up to and including $5M, and flat activity for amounts over $5M. It is important to note MIB is working with our members to improve the consistency of the data reported to us, including face amounts. While these enhancements do not affect aggregate trends, they may impact YOY comparisons by face amount. On a YTD basis, November 2024 saw flat activity for amounts up to and including $250k and growth for amounts over $250K, in the double digits for amounts over $500k.
When including age bands, ages 0-30 saw double-digit growth for amounts up to and including $5M, and double-digit declines for amounts over $5M. Ages 31-50 saw growth for amounts up to and including $5M, in the double digits for amounts over $500K up to and including $5M, and flat activity for amounts over $5M. Ages 51-60 saw growth for amounts up to and including $5M, in the double digits for amounts over $250K up to and including $5M, and flat activity for amounts over $5M. Ages 61-70 saw growth for all face amounts, in the double digits for amounts over $250K up to and including $5M. Ages 71+ saw growth across all face amounts, in the double digits for amounts over $250K up to and including $1M as well as for amounts over $2.5M.
November 2024 saw YOY growth for Term Life, declines for Whole Life, and double-digit declines for Universal Life. Term Life was up +7.4% YOY, Whole Life was down -5.7%, and Universal Life was down -16.5%. It is interesting to note that Universal Life has not seen YOY growth since November of 2023. Term Life saw YOY growth for all ages, in the double digits for ages 61+. Whole Life saw growth for growth for ages 71+, flat activity for ages 0-30, and declines for all other age bands, in the double digits for ages 51-70. Universal Life saw declines for all ages bands, in the double digits for ages 31+. On a YTD basis, Term and Whole Life are at growth while Universal Life continues to experience double-digit declines in application activity.
Monthly Percent Change Composite IndexMonthly Percent Change Age Groups.
MIB Life Index
Originally posted at MIB site