U.S. Life Insurance Application Activity Achieves Double-Digit Growth in April 2024
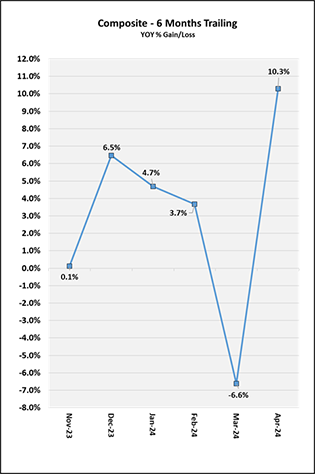
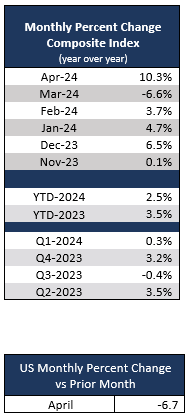
U.S. life insurance application activity saw double-digit growth in April 2024 compared to April 2023, with Year-over-Year (YOY) activity up +10.3%. This is the first month since April 2021 that activity in the U.S. has seen double-digit YOY growth in any month. When comparing April 2024 to the same month in prior years, activity was up +8.8% compared to 2022 and down -4.0% compared to 2021. On a Year-to-Date (YTD) basis, activity through April 2024 was up +2.5% compared to April 2023. On a Month-over-Month (MOM) basis, April 2024 was down -6.7% compared to March 2024, following a normal seasonal pattern of declines observed when comparing March and April activity.
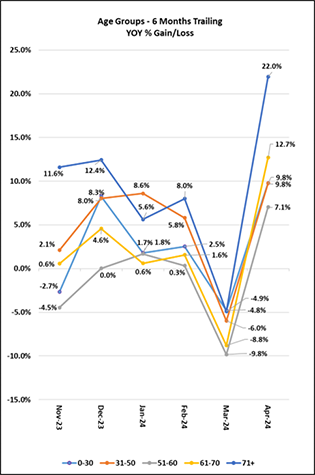
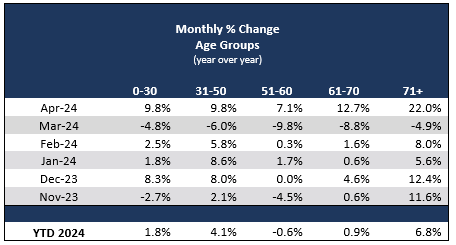
For April 2024, all age bands saw YOY growth, in the double digits for ages 61+. April YOY activity for ages 0-50 was up +9.8%, ages 51-60 up +7.1%, ages 61-70 up +12.7%, and ages 71+ up +22.0%.
April 2024 saw double-digit YOY aggregate growth across all face amounts, as well as growth for each age band and face amount. Specifically, ages 0-30 saw double-digit YOY growth for all face amounts. Ages 31-50 saw growth for all amounts, and in the double digits for amounts over $250K up to and including $1M and amounts over $2.5M, and in the triple digits for amounts over $1M up to and including $2.5M. Ages 51-60 saw growth for all amounts, in the double digits for all amounts over $250K. Ages 61-70 saw double-digit growth for all face amounts. Ages 71+ saw growth across all amounts, in the double digits for amounts up to and including $2.5M and amounts over $5M.
April 2024 saw YOY growth in Term Life, double-digit growth in Whole Life and declines for Universal Life. Term Life was up +8.4% YOY, Whole Life was up by +29.4%, and Universal Life was down -4.2%. Term Life saw YOY growth for ages 0-60, in the double digits for ages 0-30, and declining activity for ages 61+, in the double digits for ages 71+. Whole Life saw double-digit YOY growth for all age bands. Universal Life saw flat activity YOY for ages 0-30, growth for ages 31-50 and declines for ages 51+, in the double digits for ages 61+.


