

U.S. Life Insurance Activity Flat in April 2023
Originally posted by: MIB
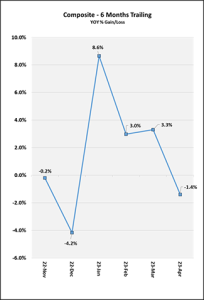
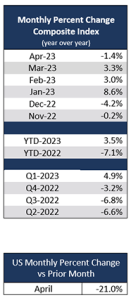
YTD activity remains up over 2022
U.S. life insurance application activity Year-over-Year (YOY) in April was flat at -1.4%. When comparing April 2023 to the same month in prior years, activity was down -13.0% compared to 2021, down -3.6% compared to 2020, and down -7.1% compared to 2019. However, on a Year-to-Date (YTD) basis, activity through April 2023 was up +3.5% compared to April 2022, down -3.8% compared to 2021, up +6.0% compared to 2020 and up +6.5% compared to 2019. On a Month-over-Month (MOM) basis, April was down -21.0% compared to March, following a normal seasonal pattern of declines when comparing March and April activity, and representing the third year in a row of double-digit MOM declines in April.
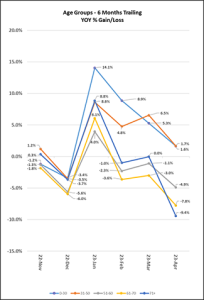
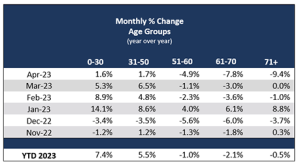
Ages 0-50 saw slight YOY growth in April 2023, while ages 51+ saw YOY declines. April YOY activity for ages 0-30 was up +1.6%, ages 31-50 up +1.7%, ages 51-60 down -4.9%, ages 61-70 down -7.8%, and ages 71+ down -9.4%. It is interesting to note the continuing fluctuations in growth by age band seen since the beginning of 2023, a trend we will continue to watch as the year progresses.
When examining YOY activity by face amount, declining activity was seen for amounts up to and including $250K, flat activity for amounts over $500K up to and including $1M, and growth for all other face amounts, in the double digits for amounts over $2.5M up to and including $5M. When including age bands, ages 0-30 saw flat activity for amounts up to and including $250K, growth for amounts over $250K up to and including $5M, in the double digits for amounts over $2.5M up to and including $5M, and double-digit declines for amounts over $5M. Ages 31-50 saw declines for amounts up to and including $250K, growth for amounts over $250K up to and including $500K, flat activity for amounts over $500K up to and including $1M, and double-digit growth for amounts over $1M. Ages 51-60 saw double-digit declines for amounts up to and including $250K, flat activity for amounts over $250K up to and including $500K, declines for amounts over $500K up to and including $1M, and growth for face amounts over $1M. Ages 61-70 saw growth for amounts over $250K up to and including $500K, double-digit growth for amounts over $1M up to and including $2.5M, and declines for all other face amounts, in the double digits for amounts up to and including $250K. Ages 71+ saw double-digit declines for amounts up to and including $250K, flat activity for amounts over $250K up to and including $500K, declines for amounts over $500K up to and including $1M, growth for amounts over $1M up to and including $2.5M, double-digit growth for amounts over $2.5M up to and including $5M, and double-digit declines for amounts over $5M.
April 2023 saw YOY growth for Universal Life, while Whole Life and Term Life saw declines. Specifically, Universal Life was up +5.7%, Term Life down -3.2%, and Whole Life down -3.7%. It is interesting to note that Universal Life has consistently seen YOY growth since November 2022.
Universal Life consistently outpaced Term and Whole Life across all age bands when comparing YOY activity. Universal Life saw double digit growth for ages 0-50, and declines for ages 51+. Term Life saw flat activity for ages 0-50, and declines for ages 51+, in the double digits for ages 61+. Whole Life saw growth for ages 0-50, and declining activity for ages 51+, in the double digits for ages 71+.
MIB LIFE INDEX
Interested in learning more?
Learn more about why MIB is the insurance industry’s partner of choice for data, insights and digital solutions.
Contact MIB