U.S Life Insurance Application Activity Flat YOY in May 2024
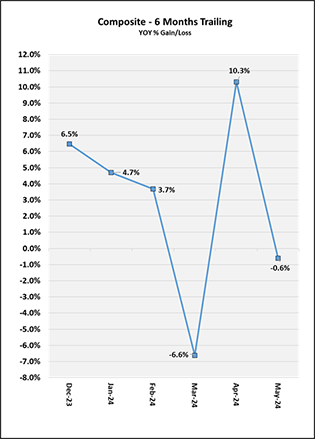
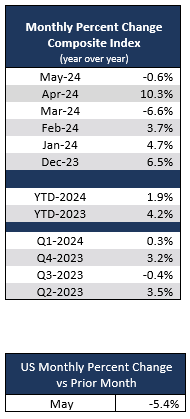
U.S. life insurance application activity was flat in May 2024 compared to May 2023, with Year-over-Year (YOY) activity at -0.6%. On a Year-to-Date (YTD) basis, activity through May remains at growth, up +1.9% compared to May 2023. When taking a historical look back, comparing May 2024 activity to that in the same month in prior years, activity was up +6.9% compared to 2022 YOY and up +5.4% compared to 2021. On a Month-over-Month (MOM) basis, May 2024 was down -5.4% compared to April 2024, following a typical seasonal pattern.
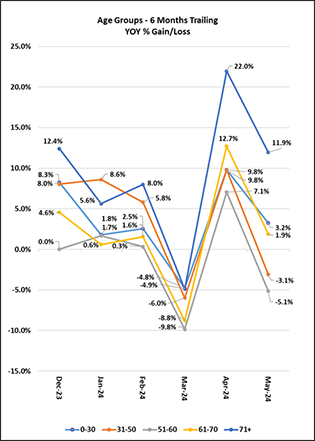
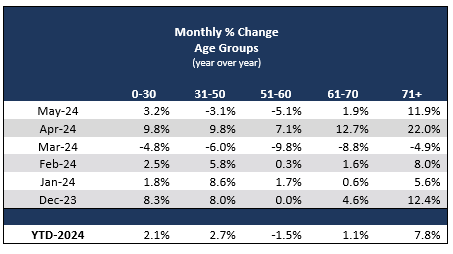
For May 2024, ages 0-30 and ages 61+ saw YOY growth, in the double digits for ages 71+, and ages 31-60 saw declines. May YOY activity for ages 0-30 was up +3.2%, ages 31-50 down -3.1%, ages 51-60 down -5.1%, ages 61-70 up +1.9%, and ages 71+ up +11.9%.
When examining YOY activity for May 2024 by face amount, we saw double-digit YOY growth for amounts over $500K, and flat activity for amounts up to and including $500K. When including age bands, ages 0-30 saw YOY growth for all face amounts, in the double digits for amounts over $500K. Ages 31-50 saw growth for amounts over $500K, in the double digits for amounts over $1M, and declines for amounts up to and including $500K. Ages 51-60 saw growth for amounts over $250K, in the double digits for amounts over $500K up to and including $1M and over $2.5M, and declines for amounts up to and including $250K. Ages 61-70 saw YOY growth for all face amounts, in the double digits for amounts over $500K up to and including $1M and over $2.5M up to and including $5M. Ages 71+ saw growth across all face amounts, in the double digits for amounts up to and including $5M and in the triple digits for amounts over $5M. It is important to note that MIB has been working with our members to enhance the detail of the data that is reported to us. Due to this effort, we are seeing an increase in the number of applications reported to MIB that include face amount detail, which may impact YOY comparisons by face amount.
May 2024 saw double-digit YOY growth in activity for Whole Life, declines for Term Life and double-digit declines for Universal Life. Whole Life was up +12.5%, Term Life was down -1.9%, and Universal Life was down -20.8% YOY. Whole Life saw growth across all age bands, in the double digits for ages 61+. Term Life saw YOY growth for ages 0-30 and declining activity for ages 31+, in the double digits for ages 71+. Universal Life saw declines for all age bands, in the double digits for ages 31+.


